
The Mucker’s Guide to Heart Rate Variability: Using Elite HRV to Conquer Colds and Train Smarter
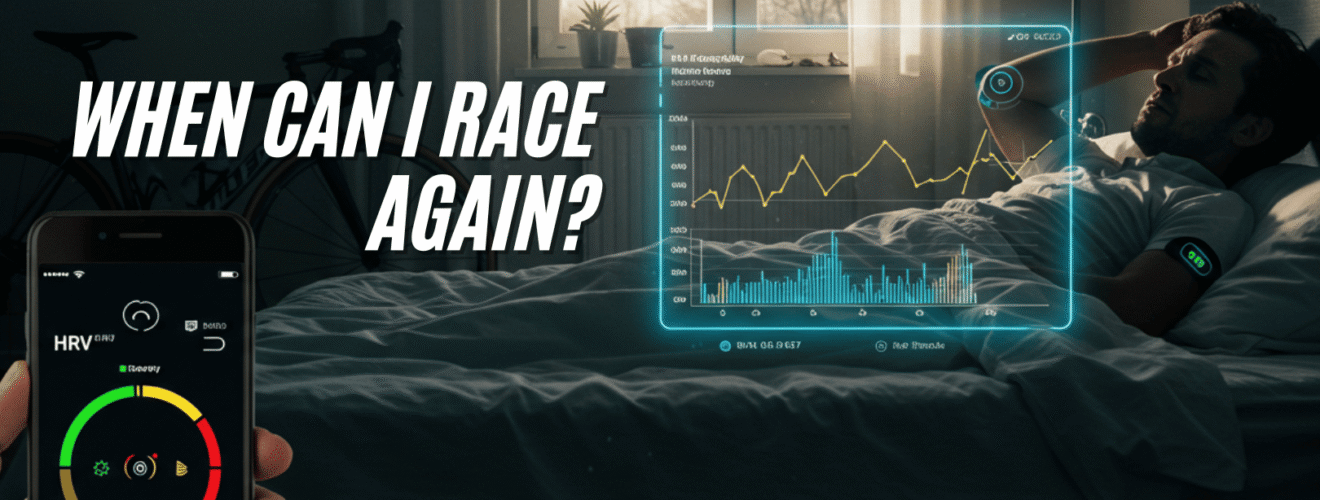
The Telltale Sign You’re Not Ready to Ride
For any dedicated cyclist, few things are as frustrating as being sidelined by illness. The scenario is all too familiar: the mind is eager to get back on the bike, but the body is weak, coughing, and laid up in bed. This creates an internal conflict, an “emotional bias” that tempts riders to ignore their body’s signals, try to “sweat out” the sickness, and ultimately prolong the recovery process. It is this very dilemma that sparked a recent conversation among the Muckers, with members Neil and “kylofski” battling colds and debating the merits of rest versus riding.
The discussion introduced a powerful alternative to guesswork: a data-driven approach using Heart Rate Variability (HRV) tracking, specifically with the Elite HRV app. This technology offers more than just another metric; it provides a direct line of communication with the body’s internal control system. It allows an athlete to replace subjective feelings and emotional bias with objective data, answering the critical question: “Is my body truly ready to handle the stress of a ride today?”.
This guide will walk the Muckers community through everything you need to know. We’ll start by demystifying the science behind HRV, explaining what it is and why it matters for an athlete’s health and performance. We’ll then provide a detailed breakdown of the Elite HRV application, including the necessary hardware and key metrics. The analysis will explore the specific impact of an illness like the common cold on HRV and, most importantly, provide a practical, step-by-step protocol for using this data to guide a safe and effective return to the bike.
What is Heart Rate Variability (HRV)? Your Body’s Built-In Stress Gauge
The Basics: A Heartbeat is Not a Metronome
The first and most crucial point to understand is that Heart Rate Variability (HRV) is not the same as heart rate. Heart rate is simply the number of times the heart beats per minute (bpm). HRV, in contrast, is the precise measurement of the time variation between each of those consecutive heartbeats. These fluctuations are incredibly small, measured in milliseconds (
ms), and are impossible to detect by simply taking a pulse.
A healthy heart does not beat with the monotonous regularity of a metronome. For example, a resting heart rate of 60 bpm does not mean there is exactly one second between each beat. A healthy, adaptable cardiovascular system might have beat-to-beat intervals of 0.9 seconds, then 1.1 seconds, then 0.95 seconds, and so on, all while averaging 60 bpm. This constant, subtle fluctuation is HRV. It is a sign of a complex, healthy system capable of adapting to challenges.
The “Why”: A Window into Your Autonomic Nervous System (ANS)
The reason these tiny variations are so meaningful is that they provide a direct window into the state of the Autonomic Nervous System (ANS). The ANS is the body’s non-conscious “mission control,” the master regulator of involuntary processes like heart rate, blood pressure, digestion, and respiration. HRV is widely considered one of the most powerful, non-invasive methods for assessing the real-time status of the ANS.
The ANS is composed of two primary branches that work in a constant state of push-and-pull, which can be understood with a simple cycling analogy:
- Sympathetic Nervous System (SNS) – “The Accelerator”: This is the “fight-or-flight” system. It prepares the body for action and stress. The SNS is what kicks in for a sprint finish, a stressful work deadline, or, critically, to mobilize the body’s resources to fight off an infection. When the SNS is dominant, the heart rate increases and the time between beats becomes more regular, causing HRV to decrease.
- Parasympathetic Nervous System (PSNS) – “The Brakes”: This is the “rest-and-digest” system. It governs relaxation, recovery, and repair. The PSNS is most active during deep sleep and periods of calm. When the PSNS is dominant, the heart rate slows, allowing for more time and thus more variation between beats, which causes HRV to increase.
What a “Good” HRV Score Means for a Cyclist
The balance between these two systems is what HRV measures, and it has direct implications for athletic readiness.
- High HRV = Adaptability and Readiness: A consistently high HRV score is a sign of a resilient, well-recovered, and adaptable nervous system. It indicates that the PSNS “brakes” are functioning effectively, and the body is well-equipped to handle stress, whether from a hard training block or daily life. For cyclists, a higher resting HRV is strongly correlated with better cardiovascular fitness, greater resilience, and improved performance potential.
- Low HRV = System Under Stress: A low HRV score is an unambiguous signal that the body is under significant load and the SNS “accelerator” is dominant. This stress can be physical (from intense training), mental (from work or life events), or physiological (from poor sleep, dehydration, or illness). A chronically low HRV is a major warning sign associated with burnout, overtraining, anxiety, depression, and an increased risk of cardiovascular problems.
This provides a direct link to the central question of this report. The physiological response to a common cold—which involves fever, systemic inflammation, dehydration, and the release of stress hormones—is a powerful trigger for the Sympathetic Nervous System. The body enters a prolonged “fight-or-flight” state to combat the invading pathogen, such as a Human Rhinovirus. This sustained sympathetic activation is precisely what causes HRV to plummet. Therefore, a low HRV score during a cold is not a random correlation; it is a direct, physiological measurement of the body’s all-out war against the infection, making it an exceptionally relevant biomarker for guiding recovery.
Your Toolkit: A Deep Dive into the Elite HRV App
What is Elite HRV?
Elite HRV is a free, yet powerful, application available for both iOS and Android devices, designed specifically for accurate Heart Rate Variability tracking. Its core purpose is to translate complex physiological data into actionable insights that help users optimize training, manage recovery, reduce stress, and even predict the risk of illness. The app is used by a wide range of individuals, from elite athletes and military personnel to doctors and people managing chronic health conditions. The developers claim its accuracy is comparable to a 5-lead electrocardiogram (EEG), the clinical gold standard, and that this accuracy is continually tested through research partnerships with over 115 universities, including Harvard Medical School.
The Non-Negotiable: Getting the Right Hardware
To obtain the high-fidelity data required for meaningful HRV analysis, a compatible chest-strap heart rate monitor is mandatory, not optional. This is arguably the most critical point for any user to understand, and it comes down to the difference in measurement technology.
Most wrist-based wearables like smartwatches and fitness bands use a technology called photoplethysmography (PPG). PPG sensors shine an LED light into the skin and measure changes in light reflection to estimate blood flow, which is a proxy for heart rate. While this is adequate for measuring average heart rate, it is generally not precise enough to capture the exact millisecond-level timing between heartbeats needed for HRV. Many PPG devices apply “smoothing” algorithms to the data to provide a stable heart rate reading, but this process actively erases the very “variability” that an app like Elite HRV needs to measure.
In contrast, chest straps use electrocardiography (ECG), which directly measures the heart’s electrical signals. This technology detects the distinct R-peak of the QRS complex for each heartbeat, allowing for the gold-standard measurement of the time between beats, known as the R-R interval. Using a PPG-based device for serious HRV analysis can be misleading and is not recommended by Elite HRV.
For Muckers looking to get started, the following ECG-based chest straps are confirmed to be compatible and are excellent choices for cyclists:
- Polar H10: Recommended by Elite HRV for its accuracy and reliability. It is widely considered the market leader for consumer HRV measurement.
- Polar H9: A slightly more budget-friendly option from Polar that still provides excellent, accurate data.
- Garmin HRM-Dual & HRM-Pro: These straps from Garmin also transmit the necessary R-R interval data via Bluetooth and are fully compatible.
The Morning Ritual: How to Take a Reading for Reliable Data
To get reliable and comparable data day after day, a consistent measurement protocol is vital. This process is designed to eliminate as many confounding variables as possible to establish a true physiological baseline.
The reading should be taken immediately upon waking, while still lying down in bed. This should be done before drinking coffee, checking your phone, having a stressful thought about the day ahead, or even getting up to use the restroom. Any of these activities can trigger a stress response and alter the reading, making it useless for comparison. The reading itself is quick, with the app requiring a minimum of 60 seconds, though a duration of 2 to 5 minutes is often recommended to capture a higher quality data sample.
Decoding the Data: Key Metrics in the Elite HRV App
After a reading, the app presents several key metrics to help interpret the body’s state:
- Morning Readiness Score (0-100): This is the app’s main output. It’s a simple, color-coded gauge (Red for “rest,” Yellow for “take it easy,” Green for “ready”) that synthesizes complex HRV data into a single, easy-to-understand score. This score is not just the raw HRV value; it’s calculated by comparing the day’s reading to the user’s personal baseline, which the app learns and refines over time.
- HRV Score (ln(RMSSD)): This is the core physiological data point. RMSSD stands for the Root Mean Square of Successive Differences between R-R intervals. It is the most common and scientifically validated time-domain metric for quantifying the influence of the parasympathetic (“rest-and-digest”) nervous system on the heart. Elite HRV applies a natural logarithm ( ln) to this value to normalize the data distribution, resulting in the ln(RMSSD) metric. For the user, the key takeaway is that a higher number generally reflects better recovery and greater parasympathetic activity.
- Autonomic Nervous System (ANS) Balance Gauge: This is a visual dial that provides crucial context by indicating whether the nervous system is currently dominated by the sympathetic (stress) or parasympathetic (recovery) branch. For instance, a “green” readiness score that is heavily weighted toward the parasympathetic side is a strong positive signal. Conversely, a score that is leaning sympathetic, even if it’s in the green, could be an early warning that stress is accumulating.
App Features and Integrations for Cyclists
Beyond the daily reading, Elite HRV offers several features valuable for athletes. It includes guided breathing exercises and live biofeedback training, which can be used to actively increase parasympathetic tone and improve HRV. The app also allows users to tag each reading with contextual data—such as sleep quality, the previous day’s training intensity (RPE), alcohol consumption, or mood—which is essential for uncovering personal trends and understanding what factors most influence recovery. Finally, it integrates with key platforms for cyclists, including Strava, TrainingPeaks, Apple Health, and Google Fit, allowing for a more holistic view of training stress and recovery.
The Enemy in the Ranks: How a Cold Wrecks Your HRV
The Science of “Feeling Rubbish”
When the body is fighting an infection like the common cold, caused by pathogens such as the Human Rhinovirus, it launches a massive, energy-intensive immune response. This process is a profound physiological stressor that goes far beyond a runny nose or sore throat. The body must divert significant resources away from normal functions and toward the battle. This immune cascade elevates core body temperature (fever), often leads to dehydration, and floods the system with inflammatory markers and stress hormones like cortisol and adrenaline.
This entire physiological state of emergency forces the Autonomic Nervous System into a prolonged state of high alert. The sympathetic “accelerator” pedal is pressed firmly to the floor to mobilize the body’s defenses, a response that is sustained until the infection is cleared.
From Symptoms to Data: What Happens to Your Metrics
This internal battle is clearly reflected in the objective data captured by HRV monitoring:
- HRV Tanks: The sustained sympathetic dominance is the direct cause of the sharp and significant drop in the HRV score. The body’s adaptability is severely compromised because all available resources are being channeled into the immune fight. Case studies based on wearable data consistently show that HRV plummets at the onset of illness, sometimes dramatically.
- Resting Heart Rate (RHR) Spikes: The same sympathetic drive that crushes HRV also elevates RHR. The heart must beat faster to meet the body’s increased metabolic demands during a fever and to help circulate immune cells throughout the body to fight the infection.
- Respiratory Rate Increases: Respiratory infections can cause inflammation and mucus buildup in the airways, making each breath less efficient. To compensate and maintain adequate oxygen levels, the body often increases the number of breaths taken per minute. This elevated respiratory rate is another measurable sign of the body’s distress.
HRV as an Early Warning System
One of the most valuable insights for an athlete is that HRV is often a more sensitive and faster-acting predictor of impending illness than either RHR or even subjective feelings. A cyclist might observe their HRV score fall off a cliff a full day or two
before the classic symptoms of a sore throat or cough fully manifest. This provides a crucial window of opportunity. By recognizing this early warning signal, an athlete can proactively cancel a planned high-intensity workout, prioritize sleep and hydration, and give their immune system the resources it needs to fight more effectively, potentially shortening the duration and severity of the illness.
The Comeback: A Muckers’ Protocol for Returning to the Bike
The Golden Rule: Respect the Red (and Yellow)
The primary message for any athlete using HRV to navigate illness is simple: a low HRV reading is an unambiguous biological command to rest. The old-school mentality of “pushing through” or “sweating it out” is physiologically counterproductive. Training is a stressor, and adding that stress on top of the significant stress of an infection will only deplete the body’s resources, compromise the immune response, and ultimately prolong the illness, delaying a true return to fitness.
Making sound decisions requires moving beyond a simplistic interpretation of the daily score. One of the most common mistakes is to base training decisions on a single data point. A single “green” day after a week of “red” is not a clear signal to resume hard training; it could be an outlier or a momentary improvement. The most reliable indicator of true, systemic recovery is the trend of the 7-day rolling average of the HRV score. A consistent, upward trend in this rolling average is the real signal that the body is winning the fight and beginning to restore its adaptive capacity.
Similarly, athletes must be wary of the “false dawn” recovery. This occurs when a rider feels slightly better subjectively and, eager to get back, immediately jumps into a high-intensity session. This new training stress, piled onto a system that is still compromised and recovering, will almost certainly cause the HRV to crash again. This creates a frustrating cycle of one step forward, two steps back, and ultimately delays the return to full strength. The comeback must be gradual and validated by data at every step.
The Muckers’ HRV-Guided Return-to-Ride Plan
The following four-phase protocol provides a structured, data-informed framework for navigating the return to training after an illness.
- Phase 1: The Sick Bay (Deep in the Red)
- HRV Status: The daily HRV score and the 7-day average are significantly suppressed below the established personal baseline. The app is consistently showing red “rest” readiness scores. Resting heart rate is notably elevated.
- How You Feel: Unwell. There are active, significant symptoms such as fever, chesty cough, body aches, and deep fatigue.
- Action: 100% rest. No riding. The only objective is to support the immune system through maximal sleep, consistent hydration, and good nutrition.
- Phase 2: The Test Spin (Climbing out of the Hole)
- HRV Status: The daily HRV score has clearly bottomed out and is now showing a consistent upward trend for at least 2-3 consecutive days. The 7-day average is beginning to climb but is still well below the normal baseline (likely in the yellow zone).
- How You Feel: Symptoms are clearly improving. There should be no fever, chest congestion, or body aches (the “above the neck” rule is a useful subjective guide). The rider may feel “okay” but is still easily fatigued.
- Action: Introduce a minimal-stress stimulus. This means a very short (30-60 minutes) and very easy (Zone 1, purely conversational pace) recovery spin on an indoor trainer or flat roads. The goal is simply to promote blood flow, not to elicit a training adaptation. The most crucial step is to monitor the HRV reading the following morning. If the score remains stable or continues its upward trend, the body has handled the load. If the score drops back down, the stimulus was too great; another full rest day is required before trying again.
- Phase 3: Building Back the Base (Back in the Green)
- HRV Status: The 7-day rolling average has successfully returned to within the normal, healthy baseline range. Daily scores are now consistently in the green.
- How You Feel: Functionally normal, though perhaps feeling a bit de-conditioned from the time off.
- Action: The rider is cleared to resume structured training, but with a “base before pace” philosophy. The focus for several days to a week should be on Zone 2 endurance rides to re-establish the aerobic foundation. Research demonstrates that low-intensity aerobic exercise has a stimulatory effect on the parasympathetic system and can aid recovery, whereas high-intensity work is a significant sympathetic stressor that should be avoided at this stage.
- Phase 4: Full Gas (Ready to Rip)
- HRV Status: The HRV is stable within or even slightly above the healthy baseline, demonstrating good day-to-day resilience to the renewed training load.
- How You Feel: Good. Several Zone 2 rides have been completed without issue, and the rider feels strong and motivated.
- Action: It is now safe and effective to reintroduce high-intensity training (intervals, threshold efforts, hard group rides). The recovery process has been successfully navigated using objective data, minimizing setbacks and ensuring a return to full strength.
Table: The Muckers’ HRV-Guided Return-to-Ride Plan
| Phase | HRV Status (Compared to Baseline) | How You Feel (Subjective) | Recommended Action |
| Phase 1: The Sick Bay | Consistently red. 7-day average is significantly suppressed. | Actively sick with significant symptoms (fever, body aches, chesty cough). | 100% Rest. No riding. Focus on sleep, hydration, and nutrition. |
| Phase 2: The Test Spin | Climbing out of red/yellow. 7-day average is rising but still below baseline. | Symptoms improving. No fever or chest congestion. Easily fatigued. | Test Ride: 30-60 min Zone 1 recovery spin. Monitor HRV the next day. If it drops, return to rest. |
| Phase 3: Building Back the Base | Consistently green. 7-day average has returned to normal baseline range. | Functionally normal, maybe a bit de-conditioned. | Resume Training: Focus on Zone 2 endurance rides for 3-7 days. No high intensity yet. |
| Phase 4: Full Gas | Stable within or above baseline. Resilient to training load. | Strong, motivated, and recovered from Zone 2 rides. | Full Training: Safely reintroduce high-intensity intervals and efforts. |
Export to Sheets
The Fine Print: Critiques, Caveats, and Best Practices
HRV is a Tool, Not an Oracle
To use HRV effectively, it is essential to understand its limitations. To establish credibility, it is important to address the critiques of consumer HRV applications. A notable review by the coaching group Uphill Athlete concluded that apps like Elite HRV can be unreliable for making simple daily go/no-go training decisions, finding a significant error rate of roughly 30% and a tendency to produce “false positives” (recommending training when rest is needed).
While this critique is valid, it primarily highlights the danger of a naive, overly simplistic interpretation of the data. The solution for the discerning athlete is to evolve beyond blindly following the daily traffic light score. By focusing on longer-term trends (like the 7-day average), layering in personal context (sleep quality, life stress, nutrition), and always validating the objective data with subjective feelings, the tool becomes far more reliable and powerful. The data informs the decision; it doesn’t make it.
The “Paradox of High HRV”: When Good Numbers are a Bad Sign
Athletes must also be aware of a critical nuance: an abnormally high HRV score is not always a good thing. In certain contexts, a sudden, sharp spike in HRV to a new record high, particularly after a period of intense training, can be a warning sign of extreme fatigue or non-functional overreaching. This phenomenon is sometimes described as a “parasympathetic rebound,” where the body, on the verge of a system crash, desperately slams on the recovery brakes.
The actionable advice is clear: if a rider feels exhausted and mentally flat after a huge training block but sees a record-high HRV score, it should be treated with extreme caution. This is likely a signal for immediate and significant rest, not a green light for another epic ride.
Best Practices for All Muckers (Sick or Not)
To get the most out of HRV monitoring for long-term health and performance, a few best practices are essential:
- Consistency is King: Measure at the exact same time (first thing upon waking) and in the same position (supine) every single morning to ensure data is comparable.
- Establish a Solid Baseline: It takes time for the app to learn an individual’s unique physiology. A minimum of two weeks, and ideally 30-60 days, of consistent data is needed to establish a reliable personal baseline against which future readings can be compared.
- Tag Your Data Religiously: Use the app’s tagging feature to log alcohol consumption, travel, poor sleep, high work stress, nutrition choices, and the RPE of workouts. This is the key to uncovering hidden patterns and learning what specific lifestyle factors move the personal recovery needle.
- Improve Your Baseline HRV: Several evidence-based interventions can improve the overall health of the nervous system and raise baseline HRV over time:
- Sleep: Prioritize consistent sleep schedules and good sleep hygiene.
- Hydration & Nutrition: Proper hydration and a nutrient-dense diet are crucial. Some research has pointed to leafy greens as being particularly beneficial for HRV.
- Limit or Eliminate Alcohol: Alcohol is a potent HRV suppressor that significantly impairs sleep quality and recovery.
- Breathing Exercises: Slow, deep, diaphragmatic breathing (e.g., box breathing: 4-second inhale, 4-second hold, 4-second exhale, 4-second hold) for just a few minutes a day can have a powerful and immediate positive effect on parasympathetic tone and HRV.
- Manage Life Stress: Mental and emotional stress impact HRV just as much as physical training stress. Techniques like meditation, yoga, or simply spending time in nature can help manage this load and improve nervous system balance.
Conclusion: Train Smarter, Recover Harder
The analysis of Heart Rate Variability provides a scientifically validated, non-invasive window into the body’s stress and recovery status, governed by the Autonomic Nervous System. The Elite HRV app is a free and robust tool for tracking this vital metric, but its effectiveness is entirely dependent on the use of an accurate ECG-based chest-strap monitor.
For an athlete battling an illness like the common cold, a significant drop in HRV is not a sign of lost fitness but a direct and expected physiological signal to prioritize rest. Attempting to train through this period of intense sympathetic stress is counterproductive. The subsequent return to training should be a gradual, phased process guided by the trend of the HRV data, not a single day’s score. This methodical approach, as outlined in the Muckers’ Return-to-Ride Plan, is the surest way to prevent setbacks and ensure a full and robust recovery.
Ultimately, tools like Elite HRV are not meant to replace an athlete’s intuition but to sharpen and inform it. By combining objective physiological data with subjective feelings, cyclists can move beyond guesswork and make smarter, more effective decisions. This leads to less time lost to illness and overtraining, fosters greater resilience, and paves the way for more consistent and powerful performances on the bike. A speedy recovery and smarter training to Neil, kylofski, and the entire Muckers community.


Nothing like new equipment, newer tech to up the indoor, online experience!
Wow this wahoo kickr bike feels much faster than the old Kickr V5 trainer - it was a covid trainer…
😮👍
Good job, Brian. This was def. not a flat TT.
cheers Karel, It was nice to be near you on the downhill to be honest. I wish i could implement…